28 May Accuracy & Precision: 1° PART

Often we read on product brochures and catalogs, statements about how accurate and precise the products are.
Great! But… what does accuracy and precision mean, what is the difference between them, and why are they used as key indicators of the blenders quality?
During this two parts article we will try to answer to these question in a very simple way.
I° PART: PRECISION
Repetita iuvant
Imagine you have been invited by a friend to try archery for the first time: after a brief explanation, your are given 50 arrows. The goal is to hit the center of a target as many times as possible.
Here is the final result:
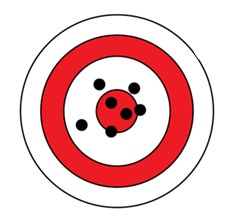
A couple of arrows hit the center of the target, however most of them ended up scattered all over it.
Your friend comment is: “quite accurate but very low precision performance!”
To better understand what your friend was referring to, let’s introduce the concept of Precision: the degree of precision is the ability of a system to repeat the same amount of output in time, In this case, how close to the others each arrow landed.
Precision in a dosing process
There are many similarities between archery and dosing processes (or automatic processes in general), in both cases one of the goals is to be able to obtain the same result over time.
While shooting arrows, all of them should land as close as possible to each others, during the dosing process the blender should be able to provide as much as possible the same amounts for each ingredient over time.
The ability of the blender to dose the same amounts for each ingredient over time is represented by its precision.
Let’s see an example:
In order to be able to monitor the precision, first it is necessary to set the recipe and choose a desired throughput (kg/h), then at constant intervals of time we take samples of one of the ingredients and weight them.
Once we have a sufficient amount of samples, let’s visualize them by displaying in a chart as shown below: the blue dots represent the single measurements (samples), the red lines indicates the maximum tolerance allowed (just for reference) and the green one the average of the observations.
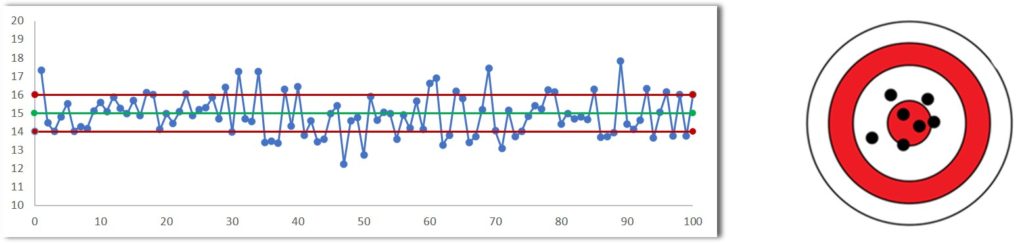
We notice that some of the measurements are close or exactly the same as the set point, some others are very far, few even exceed the tolerances. So, how would you rate the result? It is quite intuitive, however the target next to the chart might visually help to immediately recognize that the blender’s level of precision is quite low.
Since the results of the last test were quite disappointing, let’s perform another test with the same settings and same procedure, but this time we will use an high end blender.
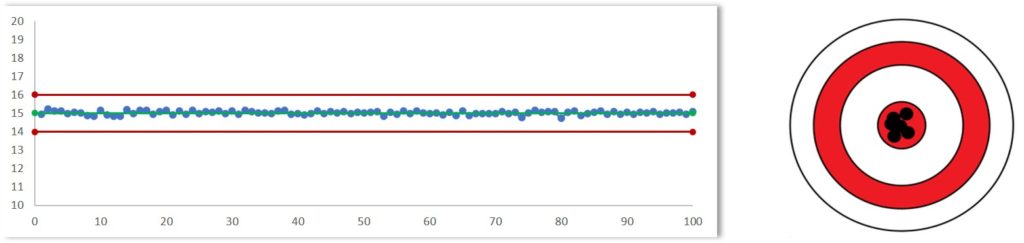
Compared to the first test, the blue dots are way less spreaded over the chart, all of them are largely within the tolerances boundaries and close to the green line representing the measurements average.
This time the ingredient is dosed almost in the same amount over time, meaning that the percentage of ingredient dosed will be almost the same in every cycle, resulting in an high precision process.
The following histograms, built with the data collected during the two sampling tests, shows clearly the difference between the two blenders:
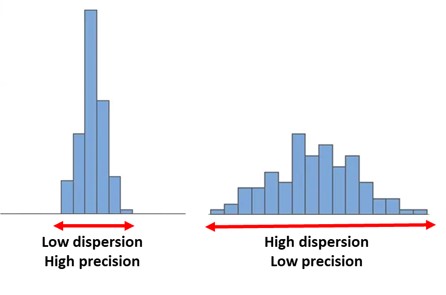
The first graph depicts a very precise process, where dispersion and variability are very low. On the other hand, the second shows high variability and a larger dispersion of the data, meaning that the blender lacks of precision.
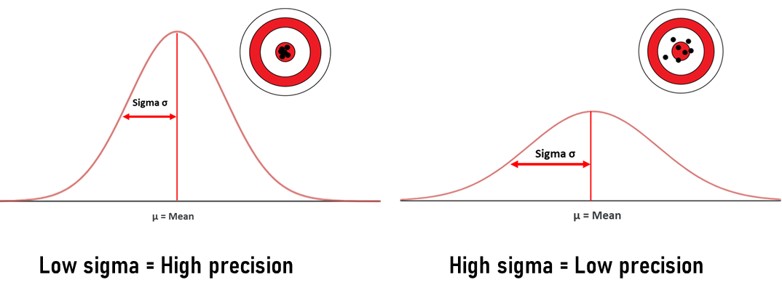
It’s all about sigma
Now the question is: how can we quantify precision?
With a value called Sigma (symbol σ)*, which represents the variability of the output.
In other words, what is the ability of the blender to provide the same amount of each ingredient over time.
The higher is sigma the more the weight of the samples will be variable, resulting in lower precision.
High precision, high quality
Precision is very important, but when it comes to high performance technical products it’s fundamental.
A very precise system will guarantee a costant proportion of the recipe ingredients, resulting in an high quality final product over the time.
For example let’s consider color fiber manufacturing: poor precision will lead to a severe fluctuations of the pigment dosed quantity over time, increasing the defects rate and consequently scrap product.
*For a more detailed explanation of Sigma and Distribution concepts, click HERE
The contents on the website www.doteco.com of which Doteco S.p.A. is the author they cannot be copied because they belong to the author himself. Copying and reproduction of the contents in any way or form is prohibited. The sharing and redistribution of content is permitted as long as the source is cited and the link to the page from which they were taken is reported. Copyright © 2020 Doteco S.p.A. All rights reserved